Hello guys!! Hope you are doing well!! Today we shall continue the last subsection. Remember I told you that we have a separate sub-section for DDMS! This is the sub-section we were talking about. This would be accompanied by study of logs. Let us not waste time and start studying this section as well.
13.3.1 Introduction to DDMS
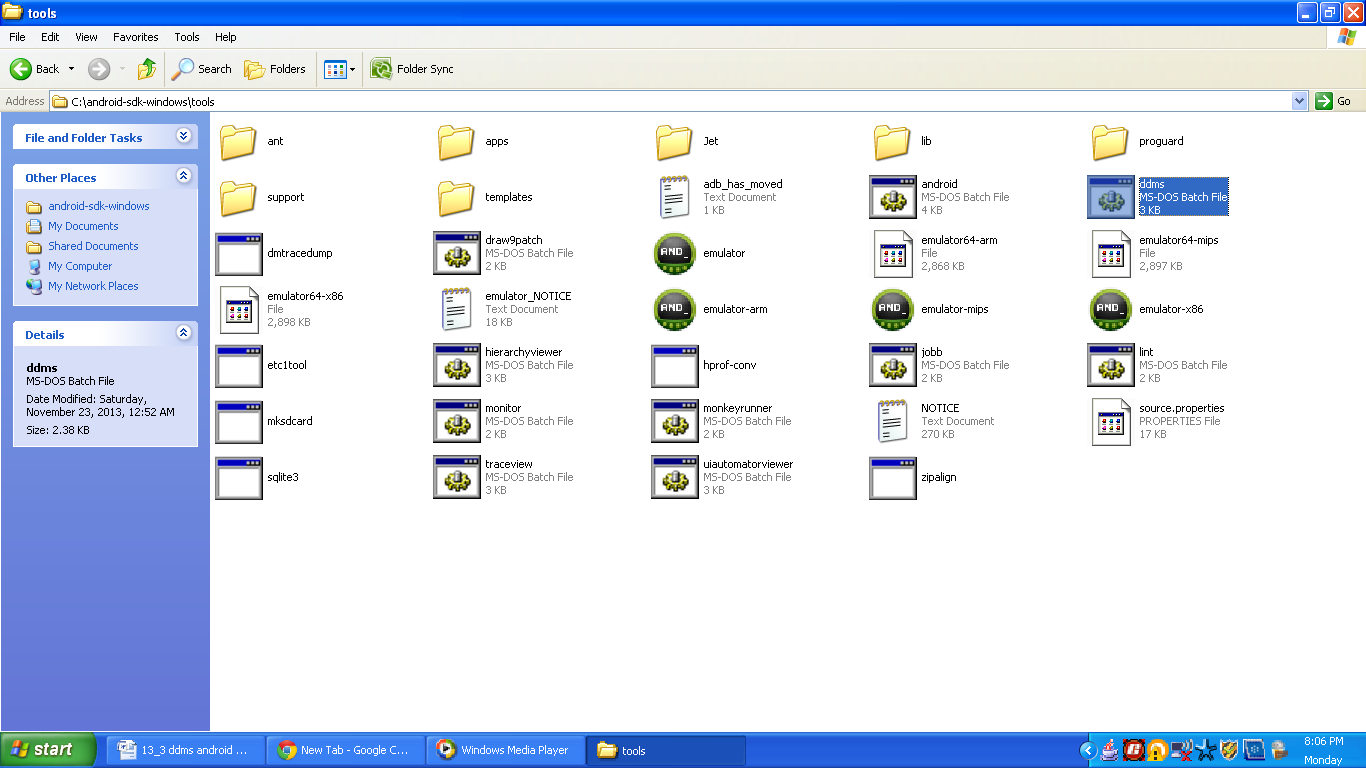
DDMS stands for Dalvik Debug Monitoring Service is basically a graphical user interface application which is meant for debugging. This application is shipped with the Android SDK. It provides process examination capabilities, log cat, screen capture, thread and heap information on device, emulating location information, emulating incoming call etc. In the tools/ directory DDMS is shipped. DDMS can function for both connected device and emulator. Although, if you have an emulator up and running, in that case DDMS would communicated with emulator by default. .

Figure DDMS in tools directory
DDMS usually works as a bridge between Integrated development environment and applications running on device. Now, android application runs on separate virtual machine. To be more specific every application has its own virtual machine that’s the simple reason why failure of one application does not hampers the performance of other application running on same device. So every application has its own process which runs into a separate a virtual machine. Each process listens for a debugger but in a different port. For running DDMS we have two ways and they are as follows:
- Command line: We have to type ddms (./ddms on Linux) from tools/ directory
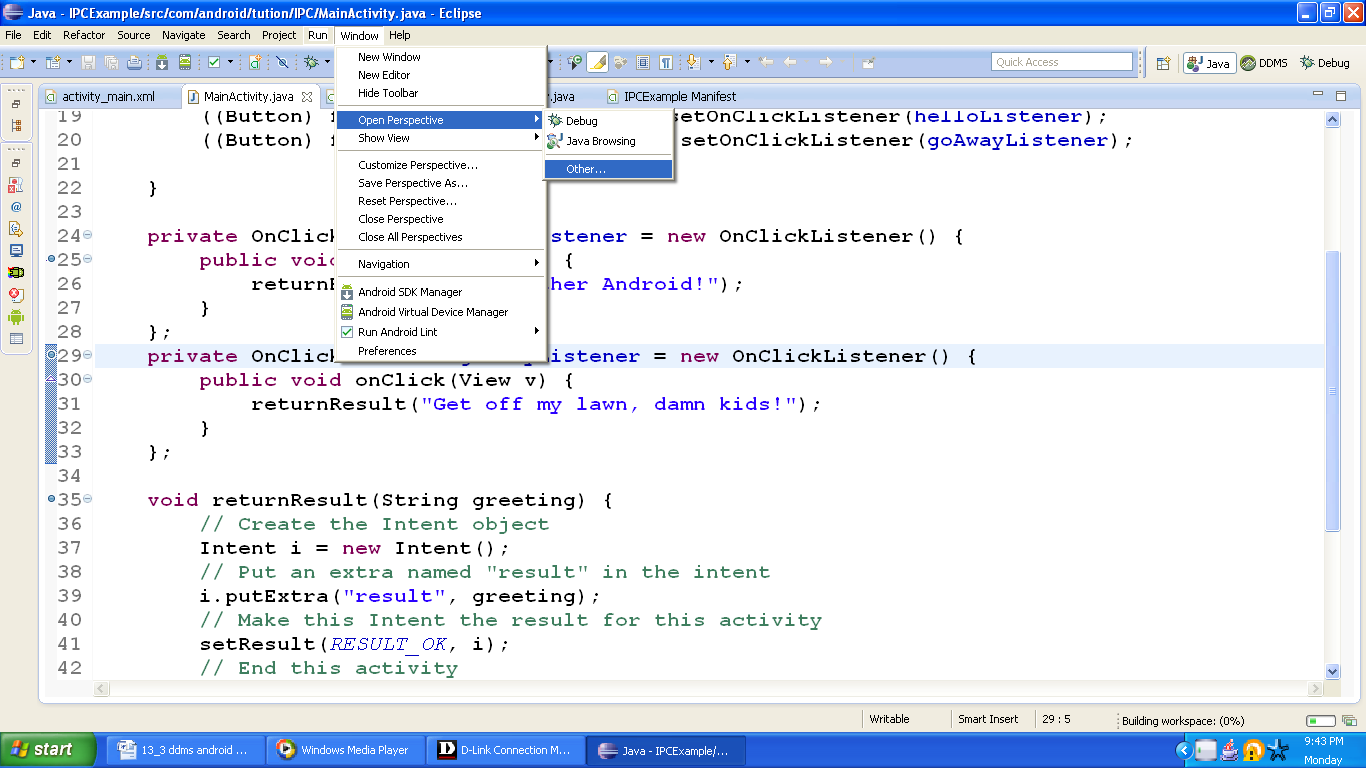
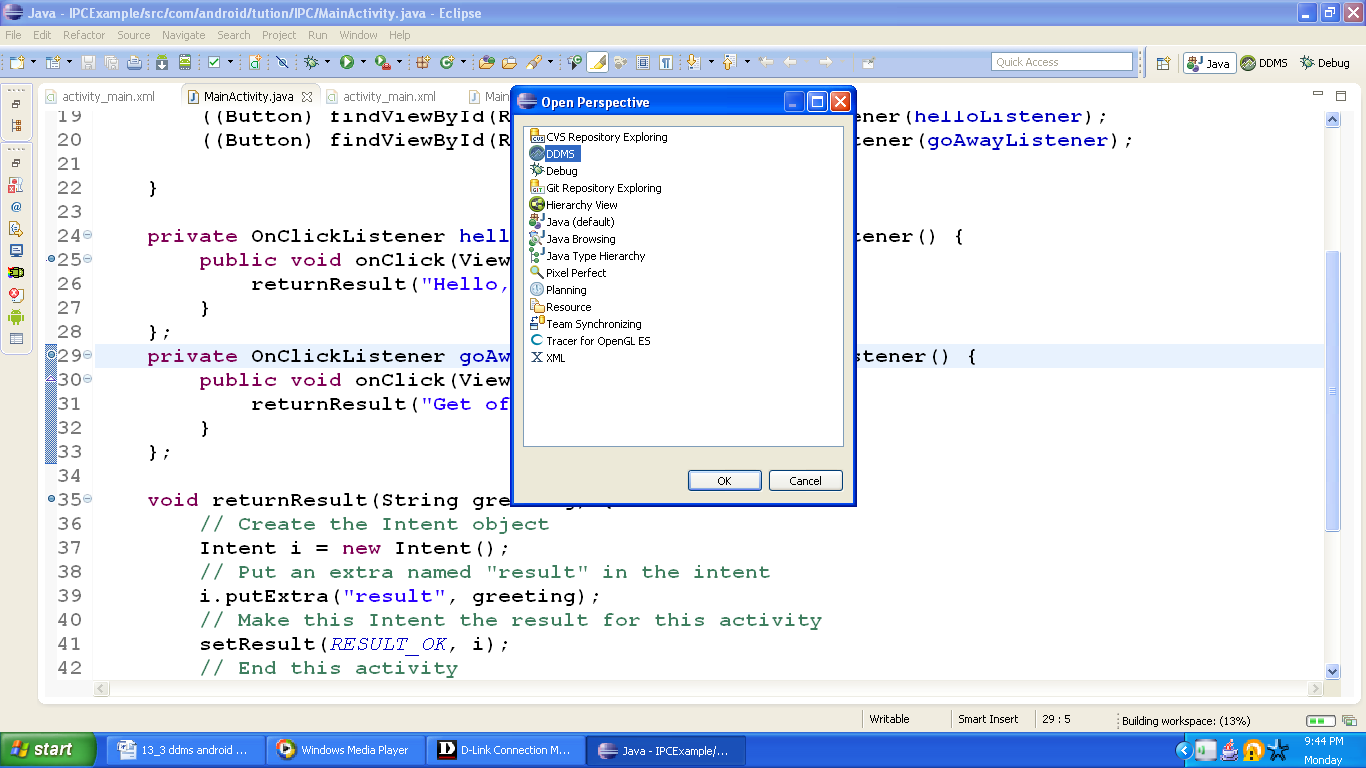
- Eclipse: In case of Eclipse we have to navigate through the following path: Window-> Open Perspective->Other.. DDMS
Following snapshot shows path from eclipse as I am running eclipse on windows operating system and it is as follows: 
Figure (a) DDMS in Eclipse

Figure (b) DDMS in Eclipse
After DDMS initializes, it connects to adb (android debug bridge) and as soon as a device is connected, VM monitoring service is created between DDMS and adb. When VM (virtual machine) on device is started or terminated, it notifies DDMS about the current status. When VM starts running, DDMS would retrieve the pid i.e., process ID of VM and it establishes a connection to debugger of VM. These things are possible as DDMS retrieves the information through adb. The adb daemon on device helps to open the connection. Thus DDMS can communicate with VM now.
When we talk about debugging, DDMS attaches one debugging port to the respective VM on device. But at the same time it can handle multiple attached ports. In other words, it will attach only one port to one VM but it can work on different ports attached to different VMs. The first debuggable VM is attached to port number 8600 and next VMs are attached by incrementing the port number by 1 i.e., 8601. But there is a base port to which DDMS always listens to by default and that port number is 8700. When debugger connects to one of the ports, traffic is forwarded to the debugger responsible for the associated VM. Now, when we talk about base port, it is a port forwarder. As a port forwarded, it can accept VM traffic from any debugging port and forward it to the debugger on port 8700. Here, it will attach one debugger to port 8700 and in turn will debug all VMs on a particular device.
Let us talk about the facilities provided by DDMS.
- Heap Memory and Threads: DDMS can be used to view the amount of heap memory used by current process. We can track heap usage at any point of execution of android application. As far as threads are concerned, DDMS shows the current threads which are running for our application.
- Tracking objects: DDMS also facilitates the tracking of objects. In other words, the objects which are allocated to memory and also the threads or classes attached to the objects respectively. This is very useful when we talk about the performance of application in terms of memory usage.
- File system: DDMS also provides a file explorer with which we can play around the file system of attached device (emulator or connected device). We can view, copy and delete files on device. This is very helpful when we intend to transfer file from one device to another. This is also useful to keep track of files created by our application on device.
- Method profiling: DDMS also facilitates method profiling. It is like keeping an eye on the number of calls to the method, time of execution, etc. In other words, keeping track of metrics of method.
- Network traffic tool: DDMS includes a Network usage tool which gives a detailed track of application making network requests. We can easily monitor the activities of application and can optimize the code as and when required. We can monitor how frequently the data is being transferred. By keeping track on this, we can make our application more battery efficient.
- LogCat: LogCat usually outputs the messages that we print out using the Log class accompanied by other system messages. LogCat is integrated to DDMS. We can filter certain messages when we use LogCat of DDMS and they are:
- Verbose { v (String, String) }
- Info { I (String, String) }
- Debug { d (String, String) }
- Error { e (String, String) }
- Warn { w (String, String) }
- Phone Operations: Using DDMS we can simulate the phone operations like incoming call or sending SMS, etc. These are:
- Voice
- SMS
- Location: Using DDMS we can also simulate location co-ordinates. We can send mock location to simulate the actual location coordinates and test the application. The geo-location flavors of data available to us are:
- Manual
- GPX (GPS exchange file)
- KML (Keyhole Markup Language)
13.3.2 Using LogCats
When we talk about log system of android it is procedure or methodology to collect and view system debug output. Now, LogCat dumps the log messages. It includes stack traces or the error messages you intended to receive in case of any err or. We can make use of Log which is a logging class to print out the messages in the LogCat. Let us discuss some of the common command line options of logcat and they are:
- -d: It dumps the log to screen and terminates
- -c: It flushes the entire log and then exits.
- -g: It prints the size of log and then terminates.
- -f <name_of_file>: It writes the output of log messages to the <name_of_file>. Although the default file is sdtout.
13.3.3 Four panels of DDMS
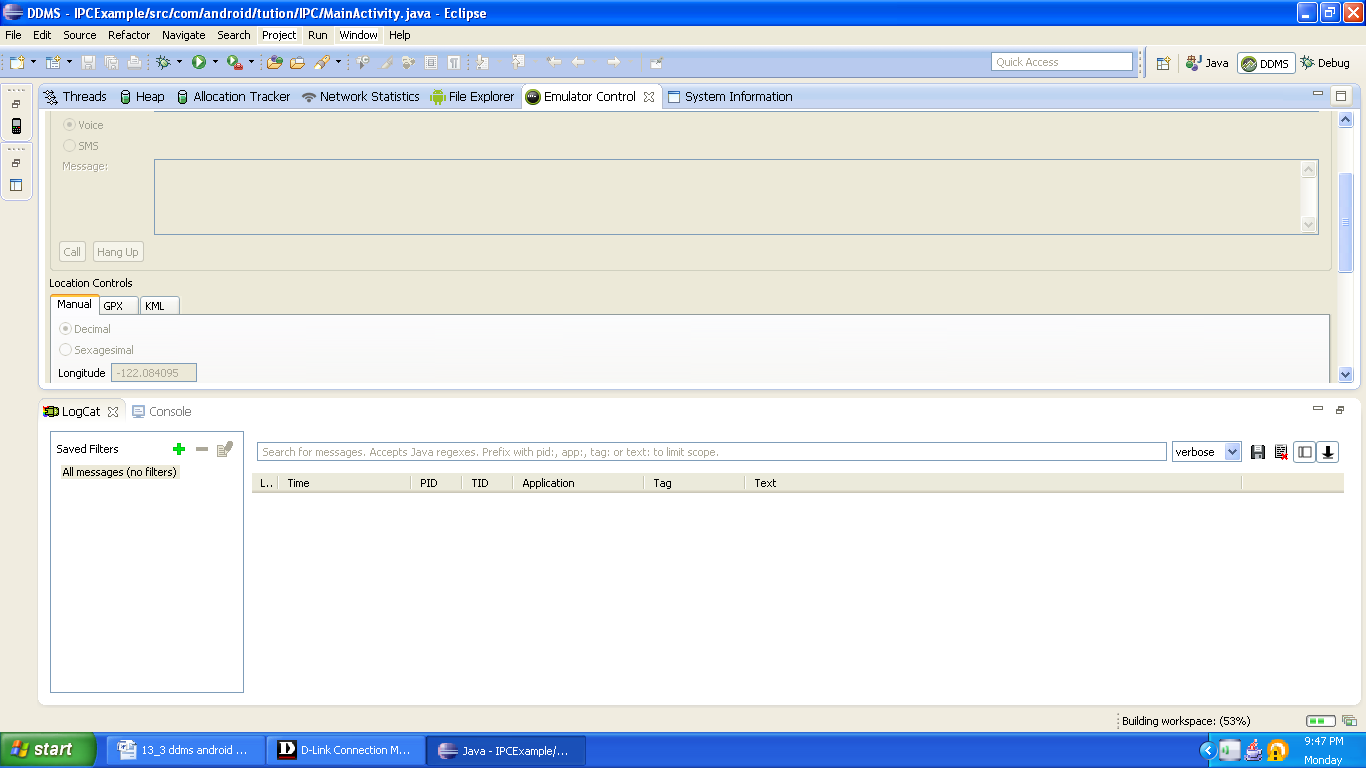
We have four panels which provides various debugging data using DDMS and they are as follows:
- Devices: This displays the connected devices. It includes real devices and emulators as well.
- Emulator Control: Various controls for injecting events and data into the emulator is possible. It includes Telephony status, Telephony Action and Location Control. Telephony status specifies the voice and data format, latency and network speed. With Telephony Action we can make false calls or send SMS. Even the message content in SMS can be specified. With Location Control it is possible to send fake GPS signal to the GPS (Global Positioning System) provider in the emulator.
- Device Status Panel: This is used to analyze the process. It includes Thread, Heap, Allocation Tracker, and File Explorer.
- Bottom Panel: This includes LogCat, Outline, and Properties.

Figure Snapshot of DDMS
Thank you guysJ and congratulations as well. We are done with this sub-section. Hope this section was resourceful to you. Catch you in the next sub-section. Till then keep practicing and Happy App DevelopingJ!!
