
Hello guys!! How are you doing? Hope we are ready to kick start a new section. This sub section is going to give an overview regarding the debugging environment of android application development platform.
The Android SDK provides almost all of the tools that we require to debug our applications. We require a JDWP-compliant debugger if we want to be able to do things such as step through code, view variable values, and pause execution of an application. If we use Eclipse, a JDWP-compliant debugger is already included and hence no setup is required there. In case you are using another IDE then you can use the debugger that comes with it. You can attach the debugger to a special port so that it can communicate with the application Virtual Machines on our devices.
13.1.1 Introduction to Debugging Environment
There are some simple common ways of debugging solutions, and they are as follows:
- Eclipse Integrated Development Environment (IDE) debugging tools
- Android tools which are obtained from the Android Software Development Kit (SDK)
- Tools which are available on the Android system
Eclipse supports debugging applications both on the Android Emulators and on real Android devices. Eclipse first determines whether an Android Emulator instance is already running or a real device is connected when we press F11 to debug. Eclipse generally deploy applications onto the running emulator or the connected device and lets’ say there is no emulator up and running then it automatically launches an instance of the Android Emulator and deploy the application in it. Do not be afraid of situation where you have more than one emulator up and running, in that case it prompts us to select the target emulator/device on which to deploy the application.
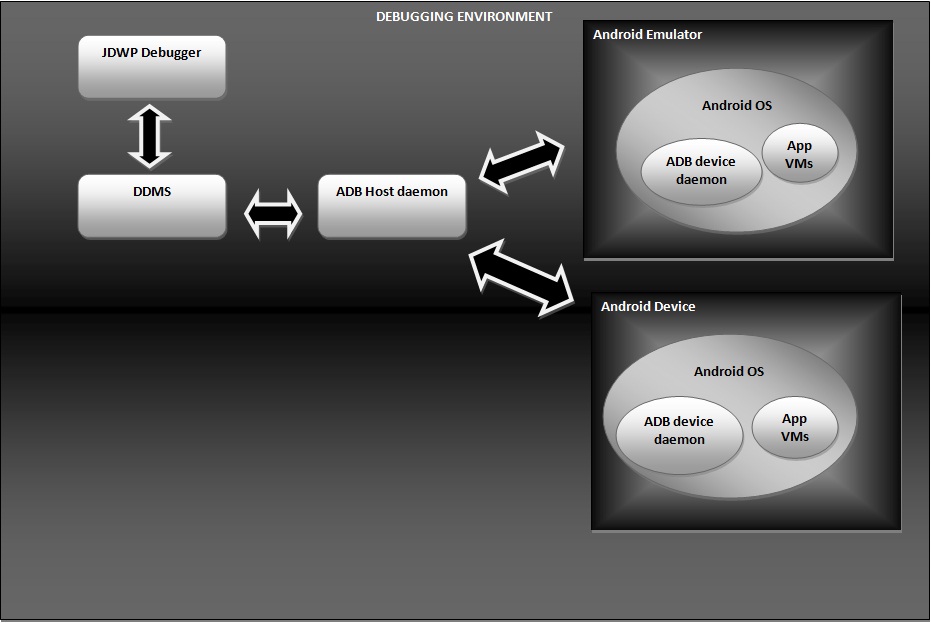
Figure Debugging Environment
Built-in tools of Eclipse include the following weapons and they are as follows:
- Run Configuration Specification
- Using DDMS
- Breakpoints
Android Debug tools are the all in one tool available for debugging. They are as follows
- Android Debug Bridge
- Log Cat
- Hierarchy Viewer
- TraceView
Android System Debug tools are the tools which we can make use of as android is built on top of Linux kernel. These tools include the following tools:
- The top command and ps command
- GDB debugging
Congratulations!! We have successfully introduced ourselves to some technical jargons which are the huge players in the field of debugging. Although we are not going to by heart detailed theoretical explanation but definitely we should have knowledge on this topic as well. See you in next section with something new. Till then keep practicing and learning. Happy App Developing!!!